Automating Marketing Analyses for Dojo Launch
April 14, 2023
Transforming Business Processes for Puffer Print: A Success Story
April 14, 2024
At Digitonic, we thrive on delivering innovative solutions that streamline business processes and enhance operational efficiency. Recently, we had the privilege of working with a company in the creative visualisation sector, transforming their financial tracking and resource management systems. Due to a Non-Disclosure Agreement, we can't disclose the client's name, but we're excited to share the nature of the work and its impact.
The Challenge
Our client managed their project financial data using Google Sheets, but the lack of a consistent format across workbooks led to inefficiencies and inaccuracies. Each project tracked financial data in different templates, making reporting and data processing cumbersome and error-prone. Additionally, there was no visibility into resource allocation or correlation between project revenue and resource utilization, hampering strategic decision-making.
Our Solution
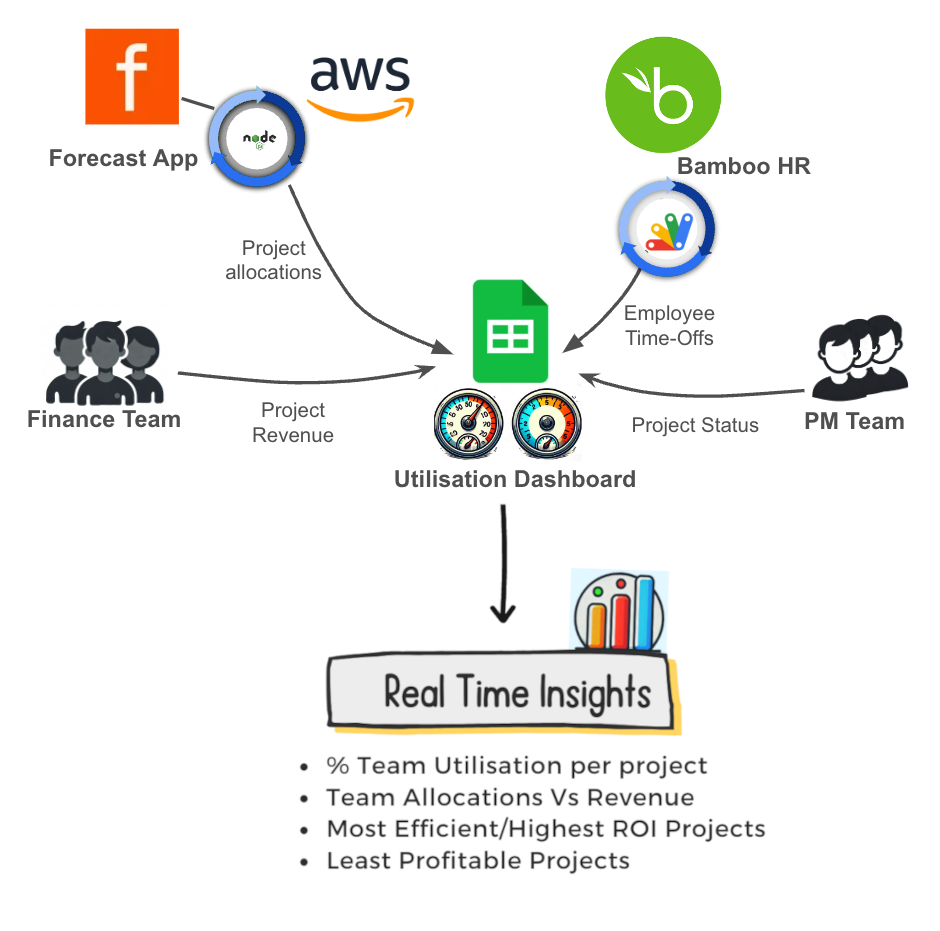
To address these challenges, we implemented a comprehensive automation and integration solution using Google Sheets, Apps Script, Bamboo HR, ForecastApp, and AWS. Here’s an overview of our approach:
Step 1: Standardizing Financial Data
We began by standardizing the format of all financial data tabs within Google Sheets. Using Apps Script, we automated the reformatting process for hundreds of tabs, which would have otherwise taken an extensive amount of time to do manually. This provided a uniform template for all financial data, simplifying future data processing and reporting.
Step 2: Adding Automated Financial Functionality
Once the tabs were standardized, we introduced several automated features:
- Currency Switching: Enabled by a dropdown menu, this functionality updated the formatting of all financial cells based on the selected currency.
- Custom Calculations: Added automated calculations to display financial totals for each tab.
- Dashboard and Financial Summary Integration: Linked the standardized tabs to a centralized Dashboard and Financial Summary, providing a comprehensive view of the company's financial status.
Step 3: Creating a Resource Management Dashboard
To enhance resource management, we created a detailed dashboard showing staff allocations and availability:
- Integration with Bamboo HR: Using Apps Script to make API calls to Bamboo HR, we pulled employee data and planned time-offs into Google Sheets.
- Data from ForecastApp: Implemented Node.js scripts hosted on AWS, running automatically via Lambda functions, to pull daily employee project allocations from ForecastApp.
- Dashboard Visualization: Combined data from Bamboo HR and ForecastApp to visualize resource allocation per project, employee availability, and overall resource utilization.
Step 4: Linking Project Revenue Data
To correlate resource allocation with project profitability, we pulled revenue data from another financial sheet into the dashboard. This integration provided a clear view of how resources were being utilized in relation to project revenue, enabling management to optimize resource allocation for maximum profitability.
Step 5: Developing a Management Weekly Meeting Dashboard
We also developed a specialized dashboard for the management's weekly meetings, displaying key metrics such as:
- Office Away Percentage: Automatically calculated and displayed the percentage of staff on leave.
- Resources vs. Revenue: Visualized the correlation between resource allocation and revenue generation.
- Project Timelines: Highlighted projects ending soon, starting soon, and flagged projects with issues needing attention.

The Results
The implementation of these solutions transformed the client's business operations by providing visibility and control over financial data and resource management. Key benefits included:
- Increased Efficiency: Standardized templates and automated processes significantly reduced manual work and improved data accuracy.
- Enhanced Decision-Making: The comprehensive dashboards enabled management to make informed decisions based on real-time data.
- Optimized Resource Utilization: Visualizing resource allocation and project profitability allowed for strategic allocation of resources to the most profitable projects.
- Improved Reporting: Consistent data formats facilitated easy addition of new reporting features and streamlined existing ones.
This project exemplifies our ability to deliver customized automation solutions that drive business efficiency and productivity. At Digitonic, we are committed to helping businesses optimize their operations through innovative technology.
If you're looking to streamline your processes and boost productivity, contact us today to discover how we can help you achieve your goals.
